Hello, I am trying to run some very basic charts in my notebook but on executing nothing happens - no image render. I browsed thru some Internet forums and tried some recommendations but none of them seem to resolve the issue.
Using Anaconda 2.6.6 on a Mac and running in Safari. I will say that the code used to work previously and I was able to display the charts with the same code.
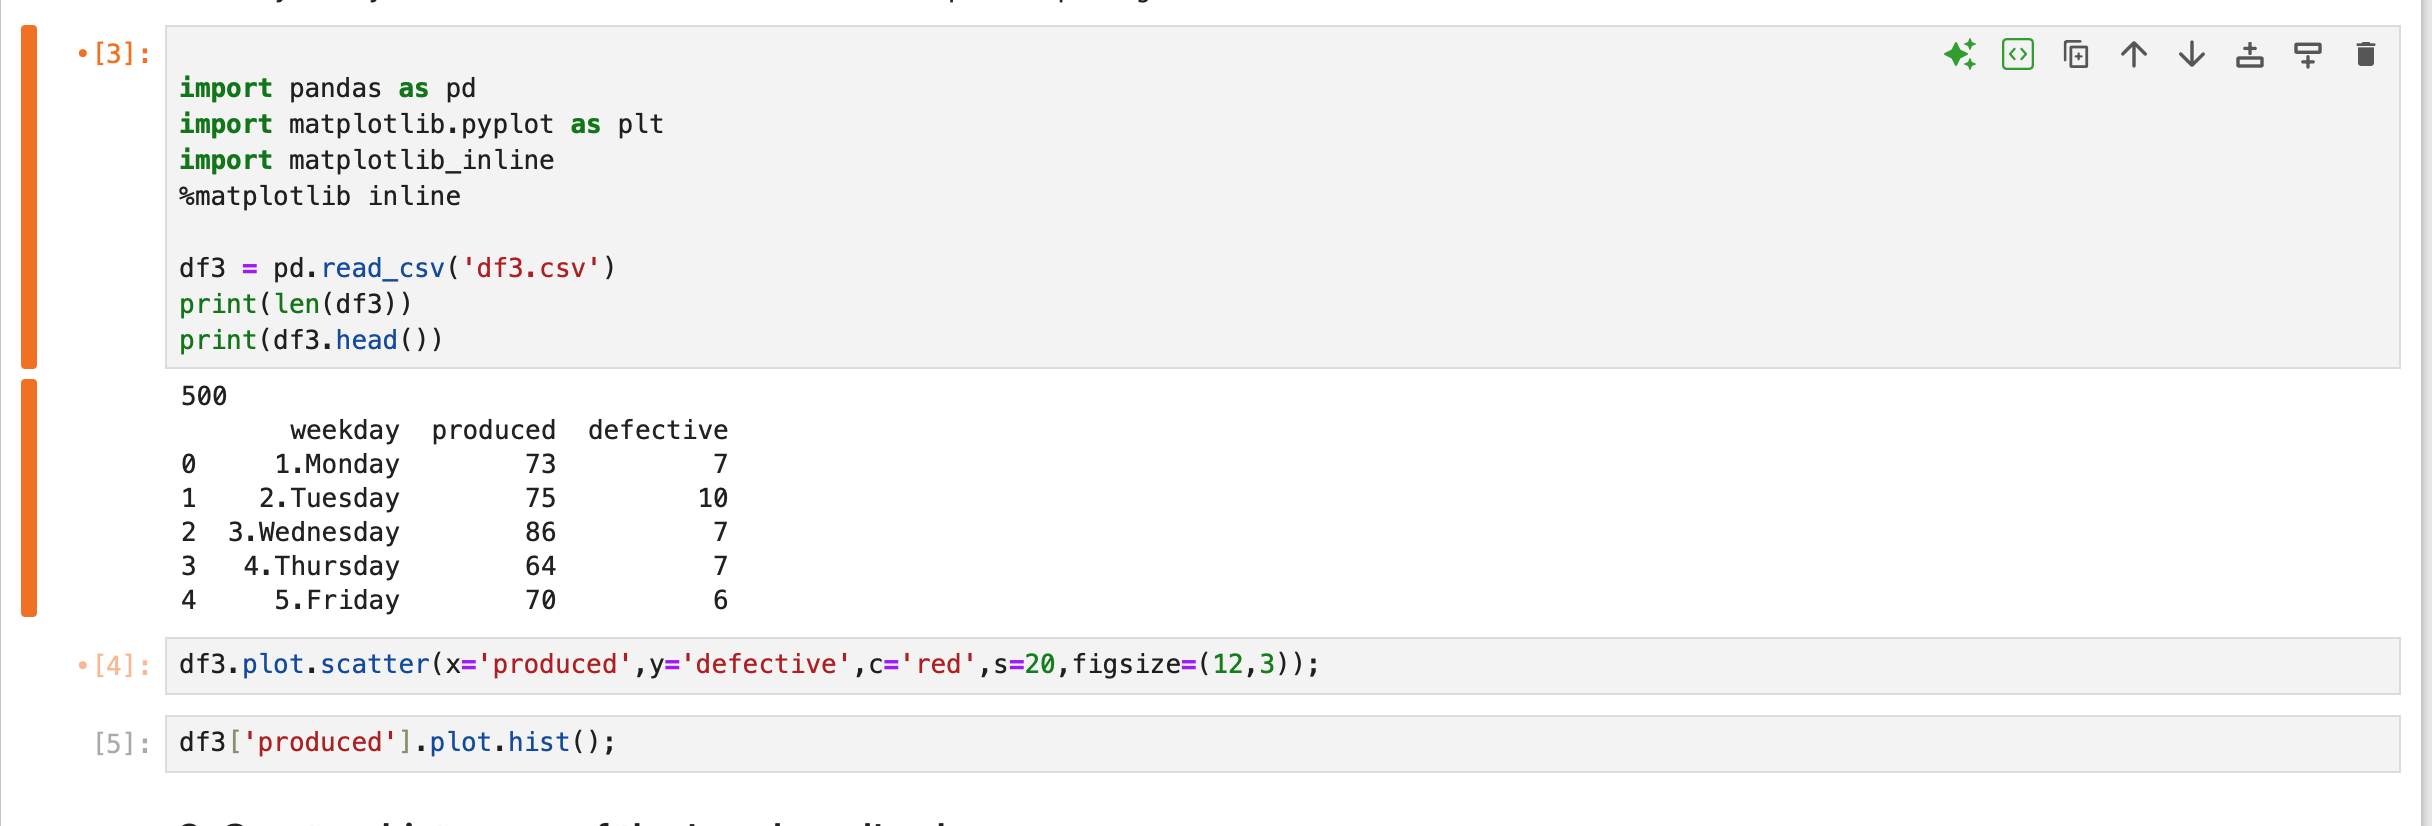
Try removing the %matplotlib inline line and restarting the kernel and running. Some users lately were reporting that was causing weirdness. It shouldn’t change it but it is something to try based on what you have shared.
While you are at that, remove the import matplotlib_inline line, too. That is not necessary and could also be causing weirdness.
Please follow common guidelines and share code as code text and not a screenshot. (Please read Getting good answers to your questions . The reference in the last link there has an entire section called ‘Help others reproduce the problem’ that emphasizes images of code don’t suffice. Help others help you by giving them the code and a minimal reproducible example.)
One easy way to share a notebook as code is GitHub Gist, see the bottom section in my post here for more about that. You can even point nbviewer at it for the best experience for all, but even providing something would be a huge step.
Thank you for your response. I don’t think the problem is with the code per se as it may be with my particular notebook environment (?). This seems to run fine on another Mac with a similar setup (only diff being that the Mac on which the charts don’t render was recently wiped out clean and is now running iOS 26 beta)
Removing import matplotlib_inline and %matplotlib inline unfortunately didn’t help either
That was a bit of a long-shot, too, but worth trying given those recent reports.
Also a bit of a long shot:
please, try removing the semi-colons at the ends of your plot code lines. It shouldn’t matter but it is unnecessary and we are trying to eliminate issues.
Have you done a hard refresh of the page you are trying to run on the new computer? Plots use a lot of javascript to interact with the front end and so it can help to clear things out so you know it is running. On a Mac in Chrome it is ‘Command + SHIFT + r’.
You would ideally print out all the versions of the packages, and Jupyter software on the the two computers and compare.
Beforehand I only got output like <Axes: xlabel=‘highway-mpg’, ylabel=‘price’>.
Removen both parts import matplotlib_inline and %matplotlib inline helped in my case and let me print the graph. I had to restart the kernel afterwards. I’m using JupytherLab on web (firefox)