Hi Guys, I have configured Prometheus and Graphana but the dashboard is still not displayed on Grafana.
The endpoint on Jupyterhub looks like this:

The config on Prometheus looks like this:
global:
scrape_interval: 15s
scrape_timeout: 10s
evaluation_interval: 15s
alerting:
alertmanagers:
- static_configs:
- targets:
scheme: http
timeout: 10s
scrape_configs:- job_name: jupyter
honor_timestamps: true
scrape_interval: 15s
scrape_timeout: 10s
metrics_path: /hub/metrics
scheme: https
static_configs:
- targets:
The config on Grafana looks like this:

I have used this Jupyterhub dashboard - JupyterHub | Grafana Labs
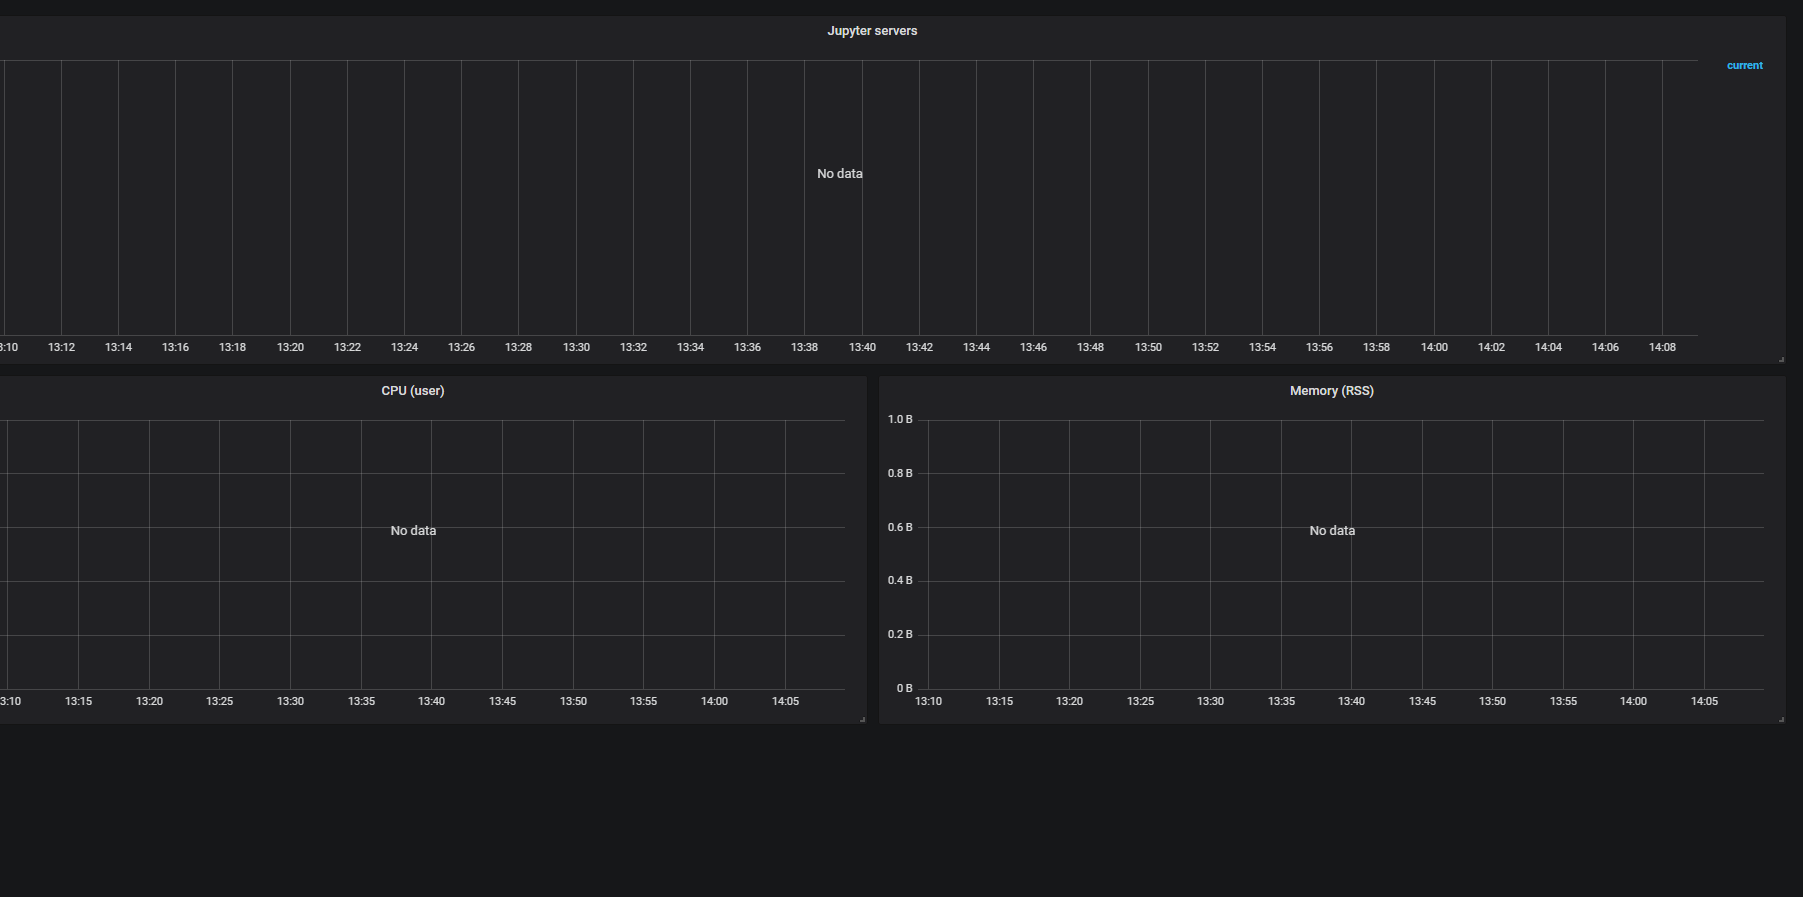
But the dashboard looks like this: