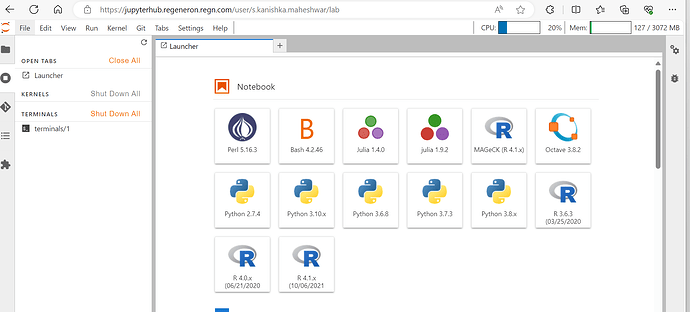
What I’m seeing is much greater values of CPU and memory utilization on the top right corner, which doesn’t seem to match htop / free -g. So, for instance, the usage on the JH extension is showing consistently that I’m using the full 480G in RAM, which is a lot. And that extension’s reading is primarily the reason why I chose such a large compute node. That said, when I htop, or use free -g, I only see ~50G of RAM consumption. Do you know what could possibly cause that?
You’ve tagged this as JupyterHub, but it sounds like you’re using JupyterLab or Jupyter Notebook (or perhaps some other front-end?). Which extension are you using to monitor your resource usage?
This is a Jupyter Server extension which you can find here. Behind it uses psutil and rss for memory usage reporting. It is not normal that the extension shows entire memory as usage. Does it show this abnormal usage for short time or long time?
I was seeing this weird thing from past four days. The actual job utilized less than 50GiB memory before the cpu and memory utilization values shown in the JupyterHub GUI is very high (almost 100%). Have to analyse the root ccause of this happening
