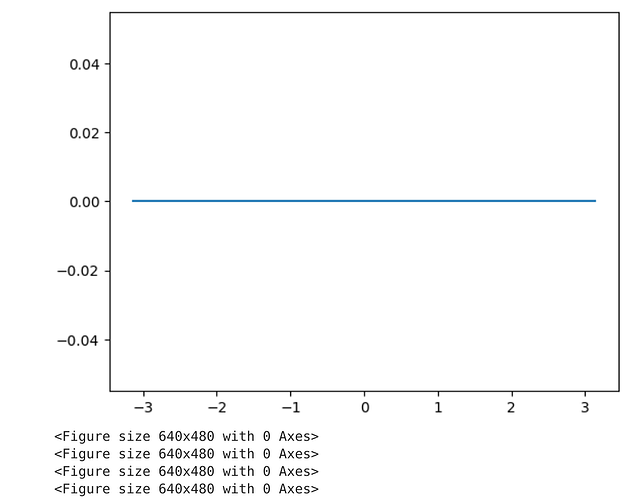
I have written a python code for iterative plot but it does not work in jupyter notebook while it runs fine on command line interface. It plots the first figure and then, prints <Figure size … 0 Axes> N-1 times but not draw inside axes. How to fix this problem in jupyter notebook? Can plotly work better than matplotlib?
The code goes ------------------------------------
import matplotlib.pyplot as plt
import numpy as np
N=5
x = np.arange(-3, 3, 0.01)
fig = plt.figure()
ax = fig.add_subplot(111)
for n in range(N):
…y = np.sin(np.pixn)
…line, = ax.plot(x, y)
…plt.draw()
…plt.pause(0.5)
…line.remove()
Without knowing more, it may be desirable to try another matplotlib plotting backend, such as ipympl. The default one is fairly basic when it comes to animation and interaction.
I could not actually get the code sample to run, so might need more information about which versions of python, numpy, etc. are installed.
1 Like
In addition to what Nicholas (bollwyvl) suggests, it also may be good to do two things in a reply:
- actually describe what you are trying to do here. It looks like you want to add a line, pause a half second, and then remove the line. This seems like you are making a bit of an XY problem to me. You maybe are thinking this is how you could what you’d like to do, but haven’t looked into what would be suggested in current Jupyter, if indeed that is what you are using. (Which leads to the next point…)
- specify what versions of Jupyter you are dealing with.
Either way, see here. If you are using current Jupyter, launch the session from there, using the launch badge that matches to your interface best. However, if you are are using older versions of Jupyter, go to there, as suggested in the first README, and launch from the badge there.
Then when the appropriate session comes up work through the notebook and see options that will work to do animations. I suspect one or more could be adapted to your needs, and then you may ultimately only need to reply with how you adapted things and detail versions involved at the time to help others and perhaps ‘future you’, who may find themselves in similar territory.
Others interested may also with to see the discussion here where the same content was posted without linking at the time.
1 Like
I am sorry that the code is wrong. The sin() part should be np.sin(np.pi*x*n). Then, the code should run in CLI such as $python a.py. As for version, I checked jupyter version and found that qtconsole is not installed. (Why is this not installed automatically?) After installation, the versions are:
IPython : 8.30.0
ipykernel : 6.29.5
ipywidgets : 8.1.5
jupyter_client : 8.6.3
jupyter_core : 5.7.2
jupyter_server : 2.14.2
jupyterlab : 4.3.2
nbclient : 0.10.1
nbconvert : 7.16.4
nbformat : 5.10.4
notebook : 7.3.1
qtconsole : 5.6.1
traitlets : 5.14.3
Now, the code runs in jupyter depending on backend. The above is %matplotlib inline. In case of nbAgg, error with “Javascript Error: IPython is not defined”. widget, ipympl opens large inline panel with so many figures nothing inside. The only “TkAgg” works fine fortunately. Why is this so tricky as for backend?
I couldn’t tell you. You don’t say how you installed things. I think some distributions of the Python ecosystem used to install it by default. However, it is from a past time, and so you shouldn’t need it these days if you do more current implementations of approaches to making animations.
As has been discussed already in this thread and related discussions, these days you want ipympl installed and use %matplotlib ipympl in modern Jupyter. This is where the development is happening.
